%202.svg)
Your nonprofit chart of accounts sorts every dollar into 5 categories. Learn the structure, numbering, and Form 990 alignment — with an example you can copy.
A nonprofit chart of accounts is the organized list of every account you use to record money moving in and out. It sorts that activity into five categories: assets, liabilities, net assets, revenue, and expenses. Every transaction you record lands in one of them.
A clear structure gives you clean financial statements and a faster Form 990. Without one, you rebuild a custom report for every board question. Most of the structure is more standard than people expect, so you can borrow it and adjust the rest.
Click here to download your free template.
Your chart of accounts is the directory behind every financial report you produce. You list each account by name and number, then group those accounts into the five categories so every dollar has a place to sit.
Nonprofits differ from businesses in one way that matters here. A company tracks owner equity. A nonprofit has no owners, so that line becomes net assets. You also track money by donor restriction, and you see both choices in how you build the revenue and net asset sections.
Most nonprofit charts use five categories, and you assign each one a range of numbers. The ranges are a convention rather than a rule, and your software may default to something a little different.
Keep related accounts near each other inside each range. Group personnel costs in the 7100s and facilities costs in the 8200s, so related figures sit together when you pull a report.
Nonprofits report two classes of net assets: net assets without donor restrictions and net assets with donor restrictions. That came from FASB's ASU 2016-14, effective for fiscal years beginning after December 15, 2017.

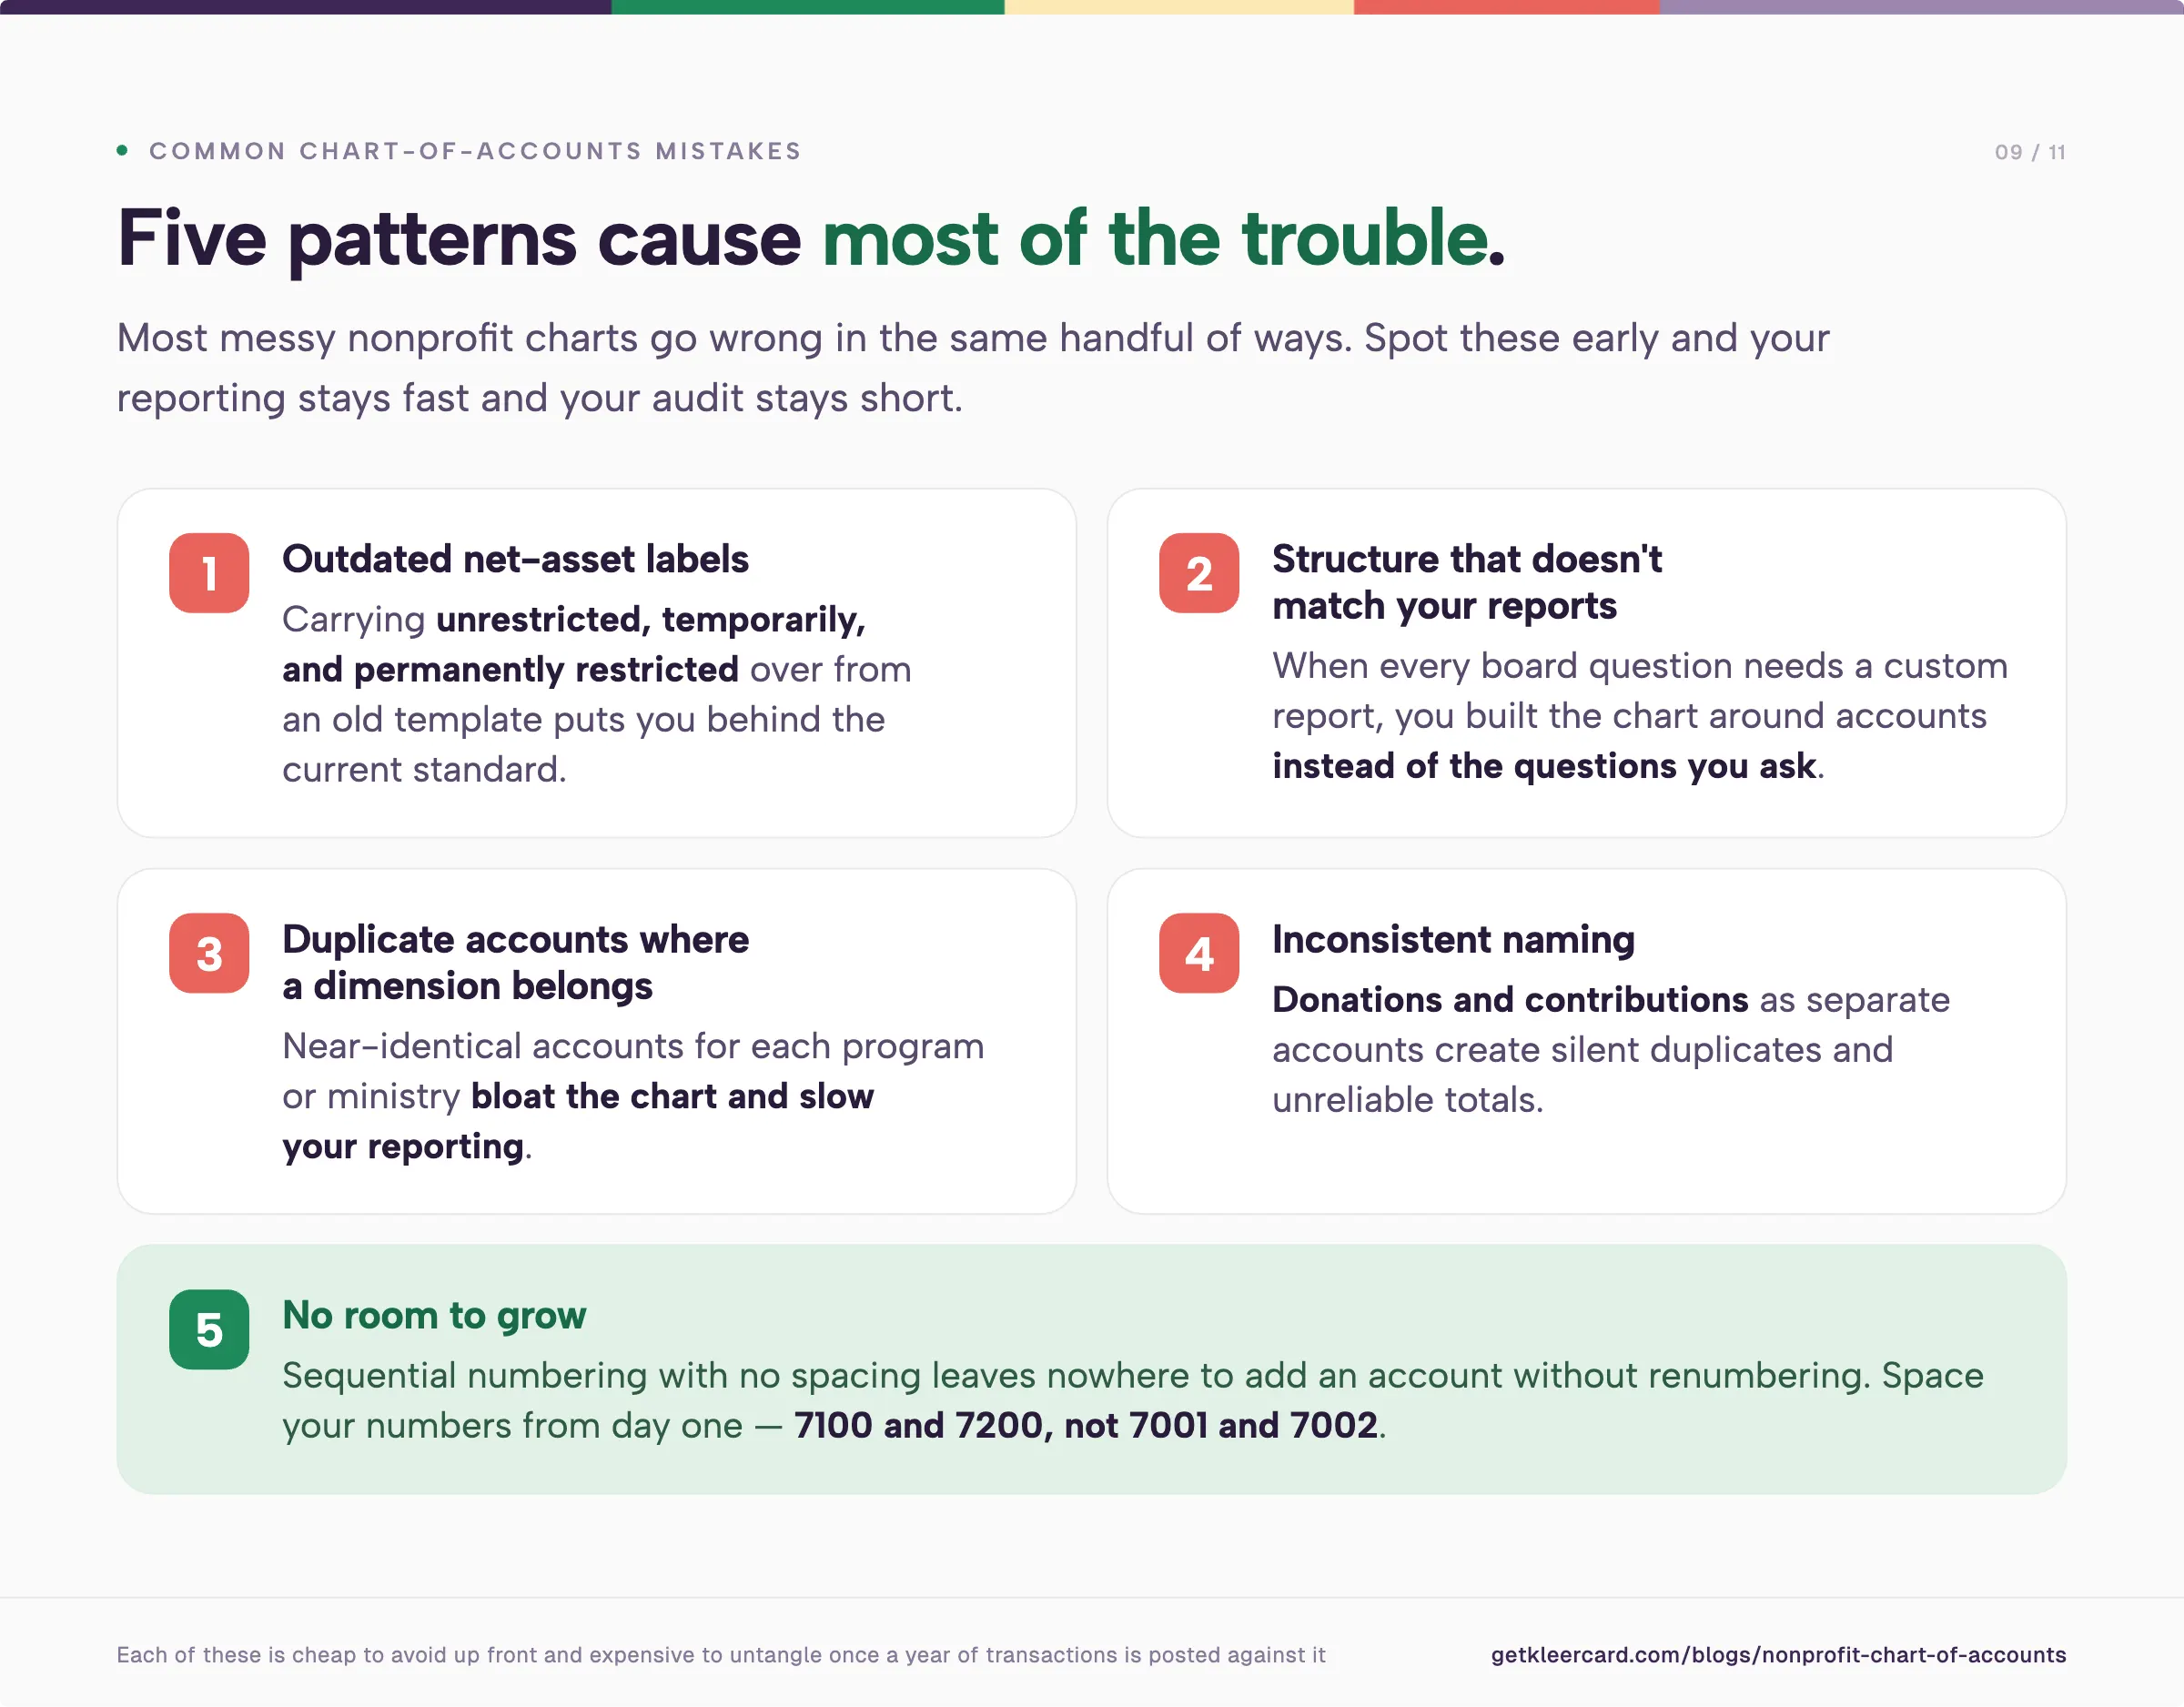
You will still see the older language in many places. Plenty of sample charts label the 3000 range as unrestricted, temporarily restricted, and permanently restricted. FASB folded those three classes into two, so a chart that still uses them is behind the current standard.
In practice, you hold one net asset account without donor restrictions and one with donor restrictions. To follow a specific grant or campaign, use a fund or class dimension instead of a separate net asset account for each one. Our guides on fund accounting and how to track restricted funds walk through how that looks in your books.
Most of your accounts roll up to your annual Form 990. Set the structure with that return in mind, and filing gets faster every year.

Part VIII is the statement of revenue. It breaks income into contributions, program service revenue, investment income, and other sources. Your revenue accounts in the 4000 range should follow those splits. Keep contributions and grants as separate accounts, and give program or tuition fees their own line too. Each one then drops onto the right part of the return.
Part IX is the statement of functional expenses. A 501(c)(3) reports every expense twice over. You record it by type, like salaries or rent, and you also assign it to a function.
The three functions are fixed:
This is where dimensions earn their place. You keep one salaries account and one rent account, then tag each charge to its function with a class or department. A bloated chart with separate "program salaries" and "admin salaries" accounts only makes that split harder. If program-versus-overhead reporting is a regular question for your board, our guide to program vs admin spend reporting goes deeper.
Part X is the balance sheet. Your accounts in the 1000 through 3999 ranges feed it directly. Order assets and liabilities from most liquid to least, and you can produce Part X with little extra work.
You number accounts to keep the chart sorted and to leave room to grow.

Space the numbers out. Use 7100 and 7200 rather than 7001 and 7002, so you can slot a new account between them later without renumbering everything around it.
Use header accounts to group and sub-accounts to record. A header like "Cash and cash equivalents" summarizes the checking and savings accounts beneath it. The header carries the totals while the sub-accounts hold the transactions.
Order your assets and liabilities from most liquid to least. Checking comes before investments, and investments come before property. You carry that same order straight through to your balance sheet.
Here is a compact example for a small or mid-size organization. Adjust the names to fit your programs, and add accounts only as you need them.
This list is short, and that is the point for most organizations. A church or school can run on something close to it and still answer detailed questions, as long as it uses dimensions for the program-level detail.
In my work as a nonprofit CFO and a church treasurer, one chart-of-accounts problem comes up more than any other. People open a new account whenever they want to track something new.
Say a church wants to know what it spends on meals across its ministries. The instinct is to set up missions meals and worship meals as separate accounts. Now every meal charge needs someone to decide where it belongs. Answering a question as basic as last year's total for meals means stitching those accounts back together.
There is a cleaner way. Keep one account, business meals, and add a dimension for the ministry or department. QuickBooks calls these classes. Other systems call them funds or departments. The account stays single, and the dimension carries the detail.
Schools fall into the same pattern with classroom supplies. I have watched schools build a separate supplies account for each grade band, which forces every teacher's purchase into a specific one. Send all of it to a single classroom supplies account instead, then tag each charge with the school level. Asking how much upper school spent becomes a filter, not a new account.
If you have used a pivot table in Excel, this will feel familiar. You can total business meals across the whole organization, then re-slice the same figures by ministry or campus. You do not rebuild a report to do it.
I see one belief behind most bloated charts. An organization tells me it is special, that its accounting is unlike anyone else's. Every nonprofit does accounting. The labels differ, departments in one place and ministries or funds in another, but the underlying data structure is the same. Treating your organization as a unique case is what produces the oversized, hard-to-report chart.
A chart of accounts can be accurate without being precise. Accurate means the figure sits in the right bucket. Precise means you keep splitting that bucket into finer detail. You do not always need both.
I see this most with small transactions. A bookkeeper paid for accuracy wants every coffee coded to its exact reason, business development one day and a team check-in the next. For a three-dollar charge, that detail does not change any decision your board will make.
Set your chart to match the decisions your leaders and board make. A good bookkeeper asks what those decisions are first, then structures the coding to serve them. If no one will act differently after you split a category three ways, leave it as one.
Decide the structure around your real reporting needs, then use coding rules and automation for the routine entries. A restaurant charge goes to business meals, and you move on.
A few patterns cause most of the trouble.
A chart of accounts only works if transactions arrive already coded. Most of the cleanup pain starts upstream, when a card charge lands with no receipt and no one assigned to it.
We built KleerCard for that part. Each charge comes in with the cardholder and a receipt attached and coded as it arrives, then syncs with your accounting software so there is less to fix at month end. That feeds your chart of accounts and supports faster reconciliation. It does not replace your accounting system.
If receipt-chasing and miscoded card spend is your monthly headache, that is the part we help with. If your close is already clean, your current setup may be all you need.
Assets, liabilities, net assets, revenue, and expenses. Most charts give each category a number range. Assets sit in the 1000s and expenses in the 7000s through 9000s, with net assets and revenue in between.
There is no required chart. The Unified Chart of Accounts (UCOA), published by the California Association of Nonprofits and the National Center for Charitable Statistics, is a widely used template. Its codes cross-reference to IRS Form 990 line items. Most organizations adapt a portion of it rather than adopting the whole thing.
Your accounts roll up to Form 990. Revenue accounts feed Part VIII, expense accounts feed Part IX, and balance-sheet accounts feed Part X. A chart built with those parts in mind makes the annual return faster to file.
Yes. GAAP and Form 990 Part IX require a 501(c)(3) to split expenses into program services, management and general, and fundraising. You can meet that with one account per expense type plus a dimension for the function, rather than separate accounts for each one.
The chart of accounts is the list of account names and numbers. The general ledger is the record of every transaction posted to those accounts. The chart is the index, and the ledger holds the detail behind it.
Enough to answer the questions your board and funders ask, and no more. Many small and mid-size nonprofits run well on a few dozen accounts, using dimensions for program and fund detail.
Yes. QuickBooks supports a nonprofit chart of accounts and uses classes for the program and fund detail that keeps your account list short.
A working chart of accounts is sized to your reporting needs. You hold the current two net asset classes and lean on dimensions instead of a longer account list. Start standard, leave room to grow, and resist opening a new account every time a fresh question comes up.
For the wider picture, our overview of nonprofit accounting covers how the chart of accounts connects to your statements and your Form 990.


Speak to a member of our team and we can have you up and running in minutes, not weeks.