%202.svg)
A nonprofit chart of accounts sorts every transaction into five categories. See the numbering, net-asset rules, Form 990 mapping, and a copyable example.
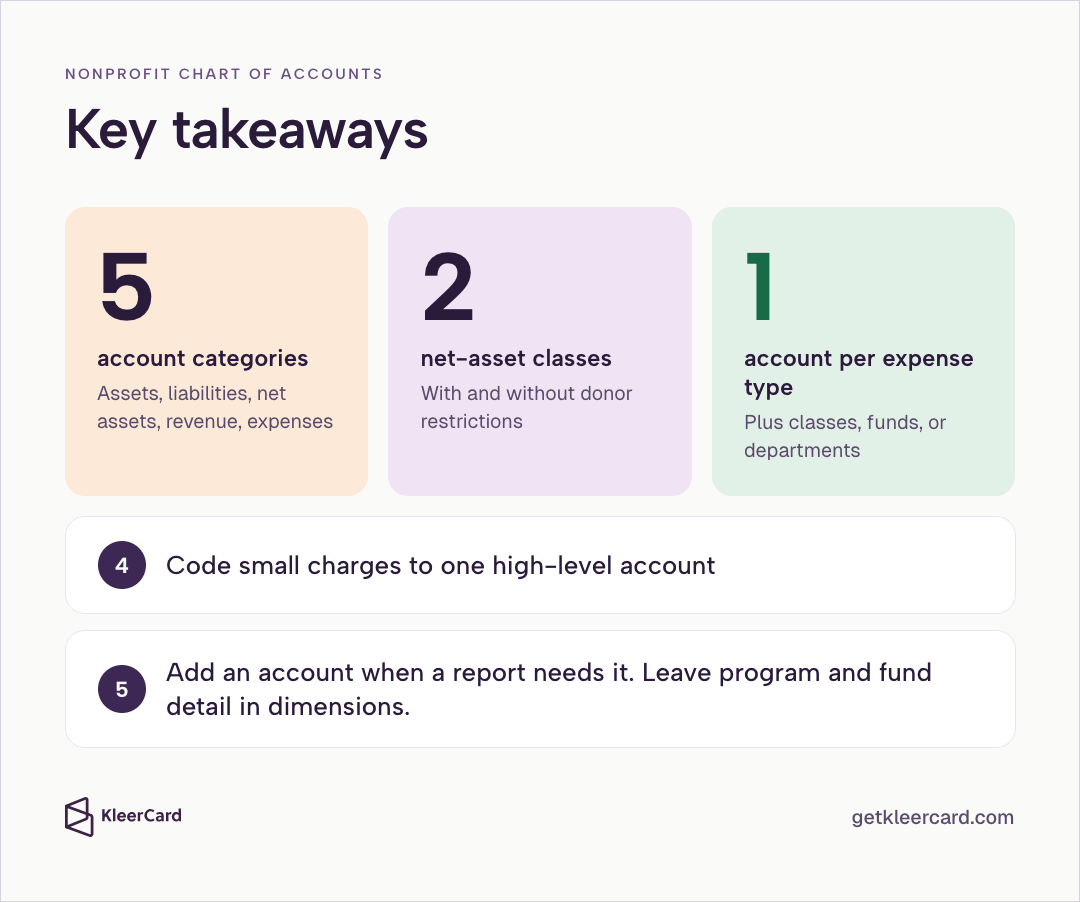
A nonprofit chart of accounts is the organized list of every account you use to record money moving in and out. It sorts that activity into five categories: assets, liabilities, net assets, revenue, and expenses.
If the accounts do not line up with the board packet, the funder report, and Form 990, someone rebuilds those reports by hand.

A nonprofit chart of accounts is the list of names and numbers. The general ledger is the running record of what posted to those accounts.
A for-profit chart tracks owner equity. A nonprofit chart has to handle donor restrictions and functional expense reporting instead. Those two requirements shape the net-asset accounts and the way expenses get tagged.
How the rest of nonprofit bookkeeping fits around that list is in nonprofit organization accounting.
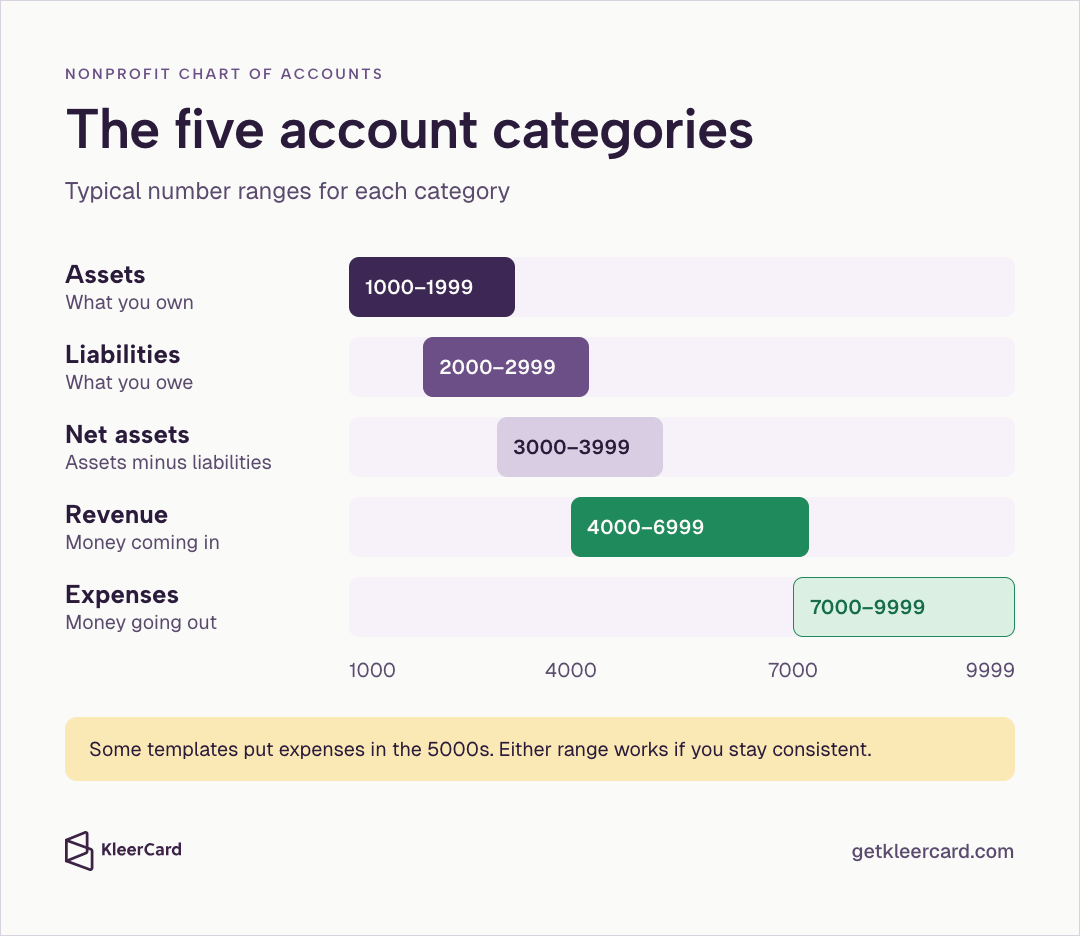
Most nonprofit charts use five categories. You assign each one a range of numbers. The ranges are a convention, not a rule, and your software may default to something slightly different. Some templates put expenses in the 5000s instead of the 7000s. Either range works if you stay consistent.
| Category | Typical number range | What it holds |
|---|---|---|
| Assets | 1000–1999 | What you own: checking, savings, grants receivable, equipment |
| Liabilities | 2000–2999 | What you owe: accounts payable, accrued payroll |
| Net assets | 3000–3999 | Assets minus liabilities; reported in place of owner equity |
| Revenue | 4000–6999 | Money coming in: contributions, grants, program or tuition fees, investment income |
| Expenses | 7000–9999 | Money going out: salaries, rent, program costs, fundraising |
Group related accounts inside each range. Put personnel costs in the 7100s and facilities in the 8200s so those lines sit together on reports. That grouping makes the balance sheet and the statement of activities easier to read.
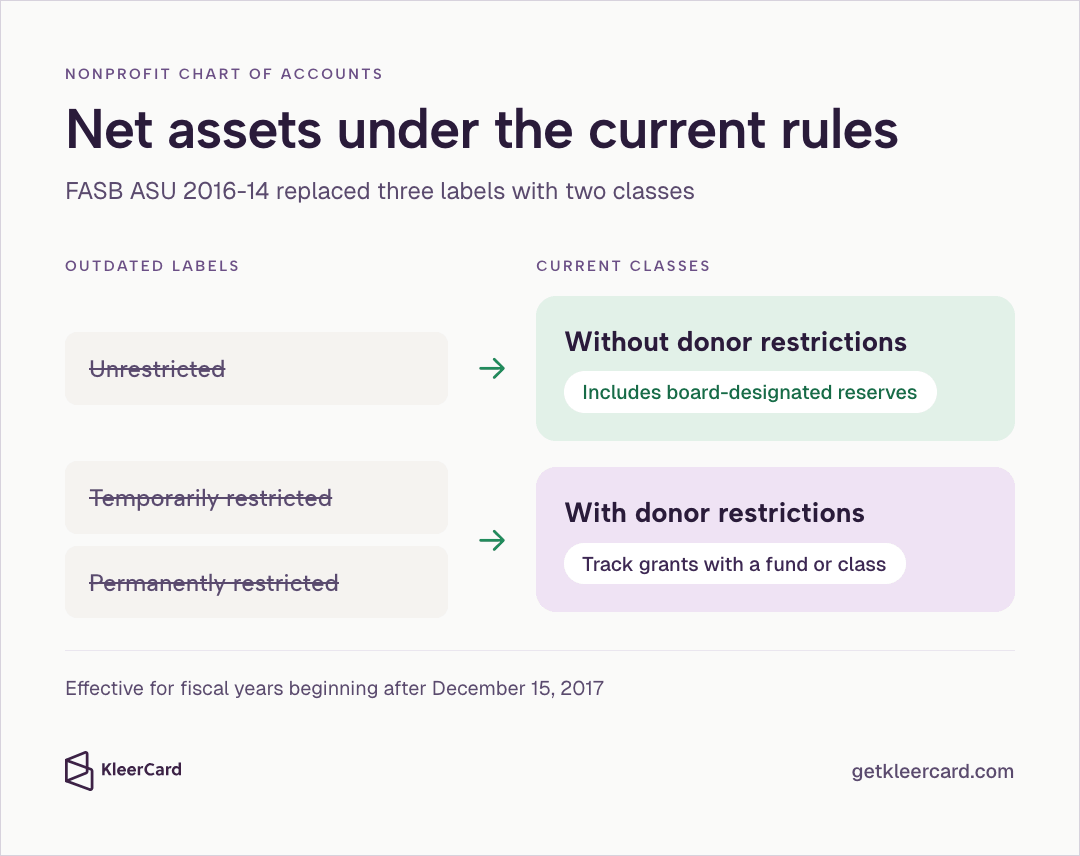
Nonprofits report two classes of net assets: without donor restrictions and with donor restrictions. That follows FASB’s ASU 2016-14, effective for fiscal years beginning after December 15, 2017.
Older labels — unrestricted, temporarily restricted, and permanently restricted — are outdated. Use one account for net assets without donor restrictions and one for net assets with donor restrictions. Track specific grants or campaigns with a fund or class dimension instead of opening a new net-asset account for every restriction.
Board-designated reserves sit inside net assets without donor restrictions. The board voted those dollars aside and can later vote to release them. A donor did not lock them. FASB still counts them inside net assets without donor restrictions.
How those restricted balances get posted after the labels are set is in how to track restricted funds in a church or nonprofit.
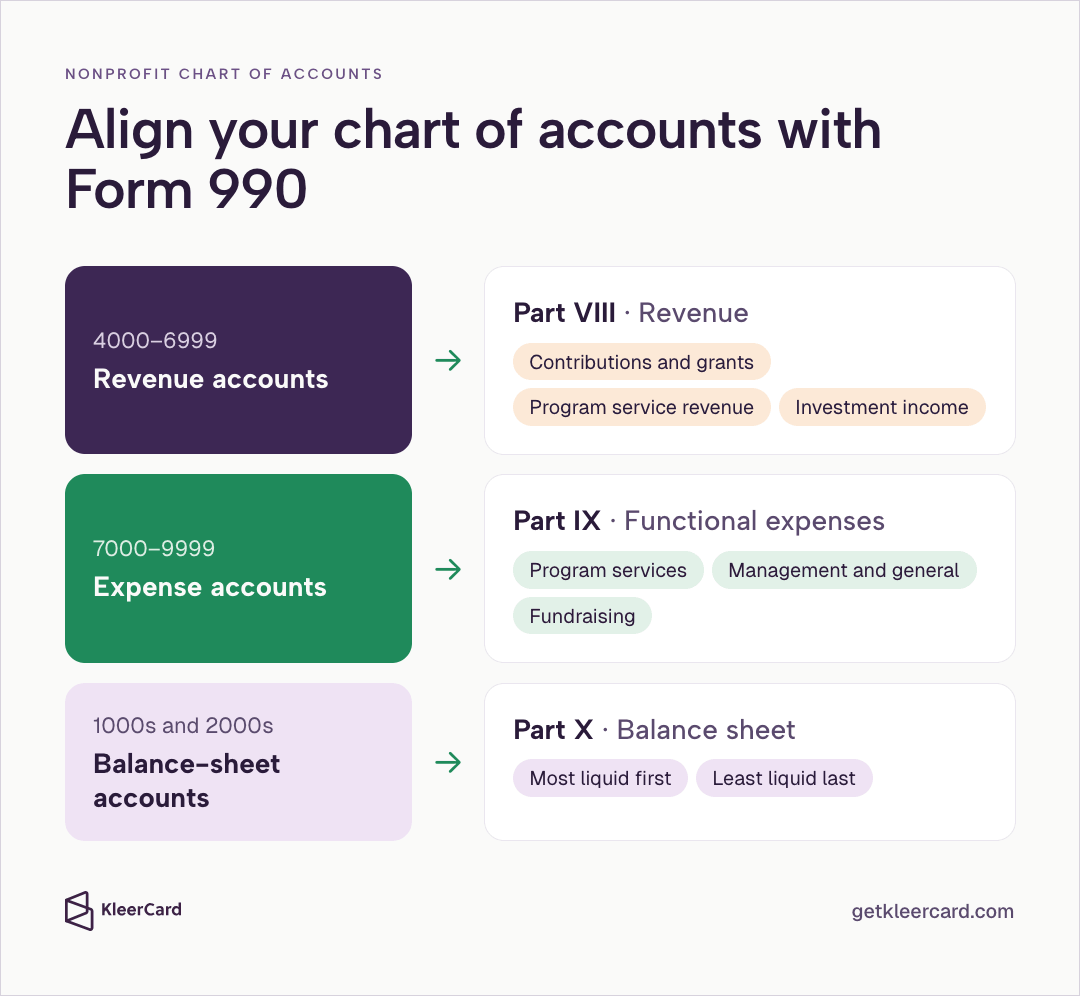
Accounts should roll up to the three main Form 990 sections. When revenue accounts match Part VIII, expense accounts match Part IX, and balance-sheet accounts match Part X, you can pull those lines into the return instead of rebuilding them. Official instructions: IRS Form 990 page.
Split revenue into contributions, program service revenue, investment income, and other sources. Keep contributions and grants separate from program or tuition fees. That split matches the IRS layout and shows the mix of support on internal reports.
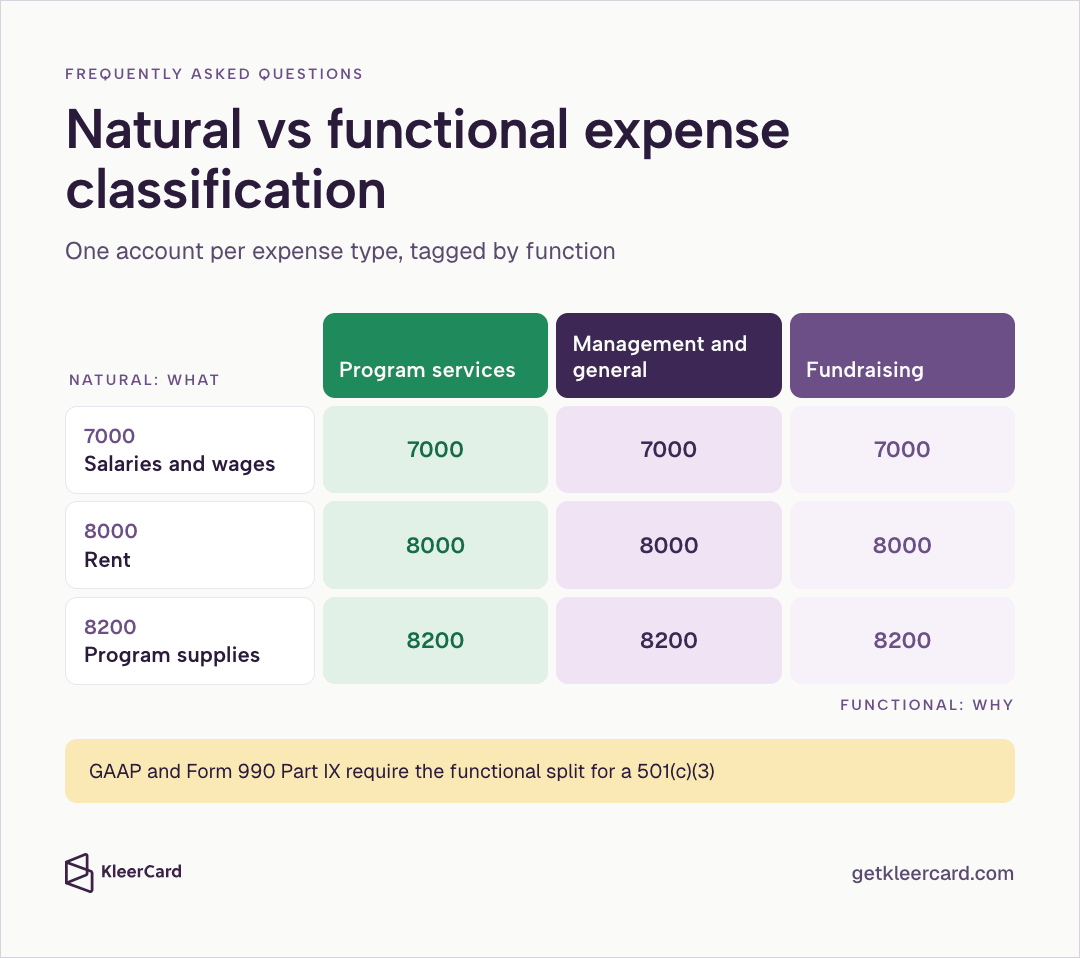
Report expenses by natural type (salaries, rent, supplies) and by function (program services, management and general, fundraising). GAAP and Form 990 both require the functional split. Meet it with one account per expense type plus a dimension for the function.
Do not create a separate account for every program-function combination. Practical notes on this split appear in program vs admin spend reporting.
Assets in the 1000s and liabilities in the 2000s feed the balance sheet directly. Order them from most liquid to least liquid. Cash and receivables come first. Equipment and long-term debt come later. Most audited statements use that same order, so the mapping stays simple.
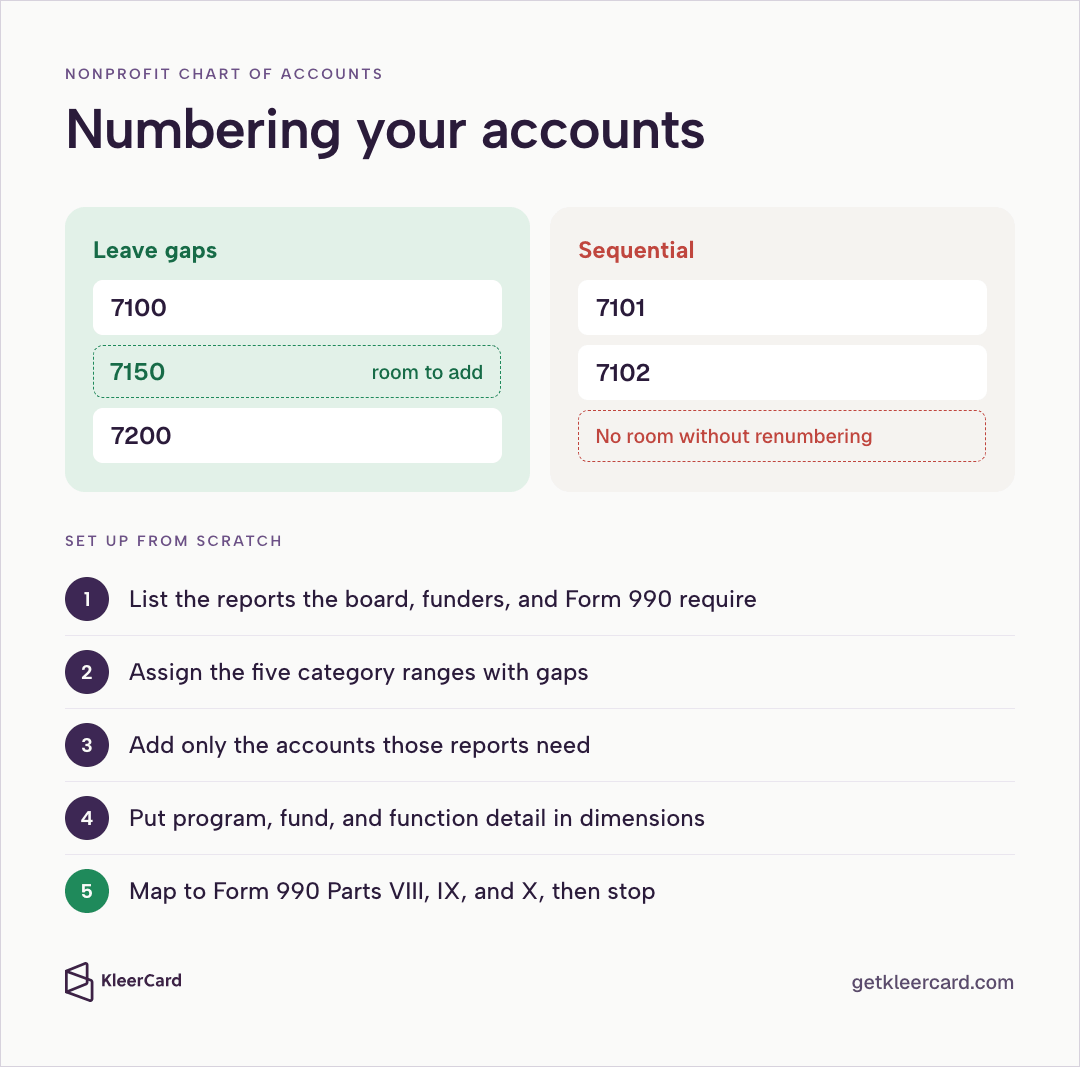
Number a nonprofit chart of accounts with gaps so you can add a line later without renumbering. Number 7100, then 7200, rather than 7101, 7102.
Create header accounts for grouping, such as Cash and cash equivalents, and sub-accounts for the actual transactions. Do not record transactions on header accounts. Those lines only total the accounts under them.
Order assets and liabilities by liquidity. The balance sheet is easier to read, and you are less likely to put a line in the wrong place when you prepare the statements.
To set up a nonprofit chart of accounts from scratch:

Here is a compact example for a small or mid-size organization. Adjust the names to fit your programs. Add an account only when a report needs it.
Assets
| Number | Account |
|---|---|
| 1000 | Checking |
| 1010 | Savings |
| 1100 | Grants receivable |
| 1200 | Pledges receivable |
| 1500 | Equipment |
Liabilities
| Number | Account |
|---|---|
| 2000 | Accounts payable |
| 2100 | Accrued payroll |
| 2200 | Payroll taxes payable |
| 2400 | Deferred revenue |
Net assets
| Number | Account |
|---|---|
| 3000 | Net assets without donor restrictions |
| 3100 | Net assets with donor restrictions |
| 3200 | Board-designated net assets (without donor restrictions) |
Revenue
| Number | Account |
|---|---|
| 4000 | Individual contributions |
| 4100 | Grants |
| 4200 | Program or tuition fees |
| 4300 | Event revenue |
| 4400 | Investment income |
Expenses
| Number | Account |
|---|---|
| 7000 | Salaries and wages |
| 7100 | Payroll taxes and benefits |
| 8000 | Rent |
| 8100 | Utilities |
| 8200 | Program supplies |
| 8300 | Travel |
| 8400 | Fundraising |
This list is short on purpose. Most of the detail lives in dimensions — QuickBooks classes, funds, or departments — rather than in extra account numbers.
In my work as a nonprofit CFO and a church treasurer, including years at Compassion International and with Switch Consulting, one chart-of-accounts problem comes up more than any other. People open a new account whenever they want to track something new.
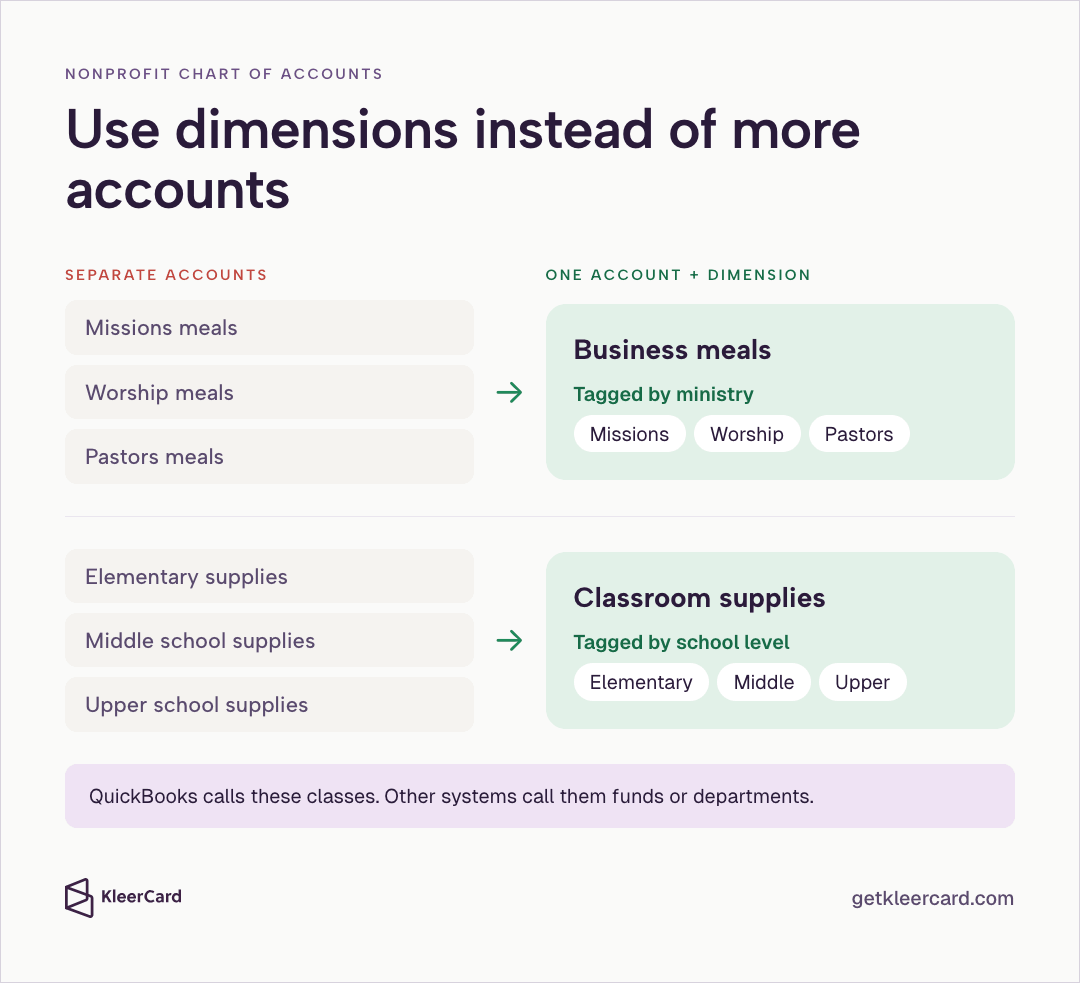
Say a church wants to know what it spends on meals across its ministries. The usual move is to set up missions meals, worship meals, and pastors meals as separate accounts. Every meal charge then needs someone to pick a line. Last year’s total for meals takes a custom report that stitches those accounts back together.
The better option is to keep one account (business meals) and add a dimension for the ministry or department. QuickBooks calls these classes. Other systems call them funds or departments. The meals account stays one line. The class, fund, or department tag holds the ministry.
Schools hit the same pattern with classroom supplies. Separate supplies accounts for elementary, middle, and upper school force every teacher’s purchase onto a specific line. Send all of it to one classroom supplies account, then tag each charge with the school level. You can then pull the upper-school total from that one account.
If you have used a pivot table in Excel, this will feel familiar. You can total business meals across the whole organization, then break the same figures out by ministry or campus. You do not rebuild a report to do it.
Call the tags departments, ministries, or funds. Keep one meals account and one supplies account, and mark each charge with the ministry or school level.
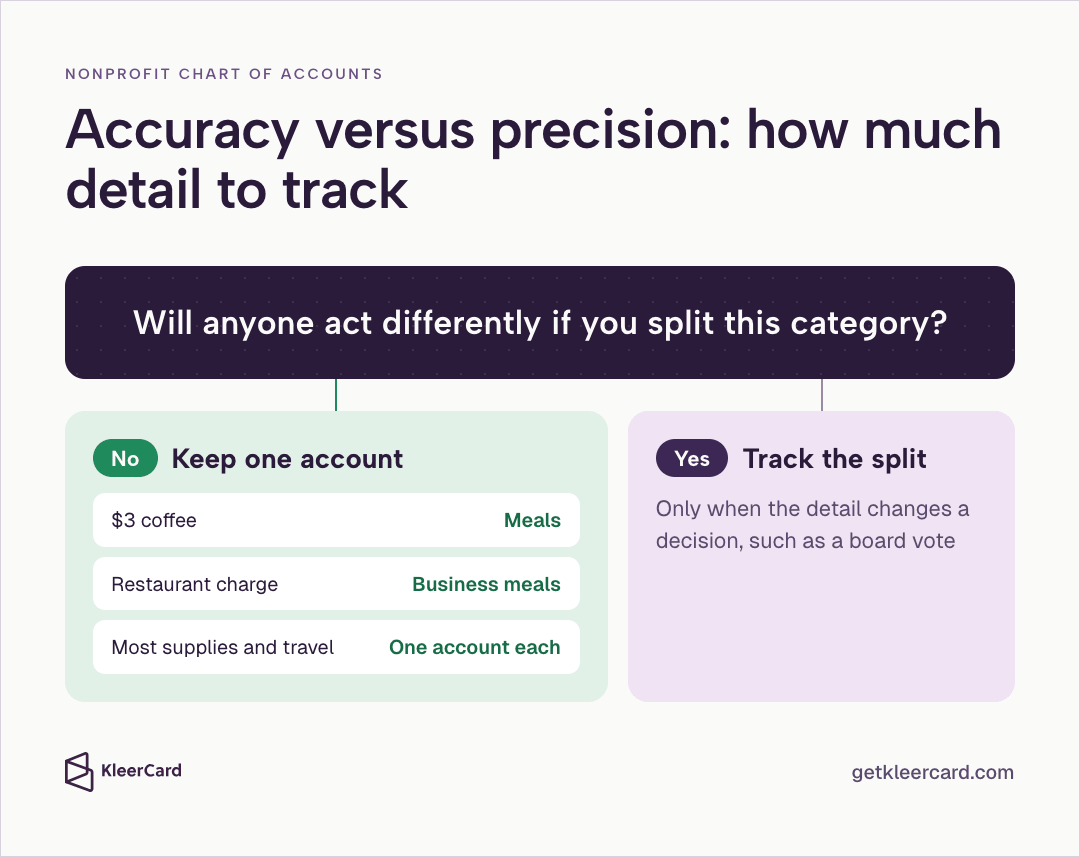
On a nonprofit chart of accounts, a three-dollar coffee split between business development and a team check-in does not change a board vote. Put it in meals and move on.
If no one will act differently after you split a category three ways, leave it as one account. A restaurant charge goes to business meals. The same logic applies to most program supplies and travel.
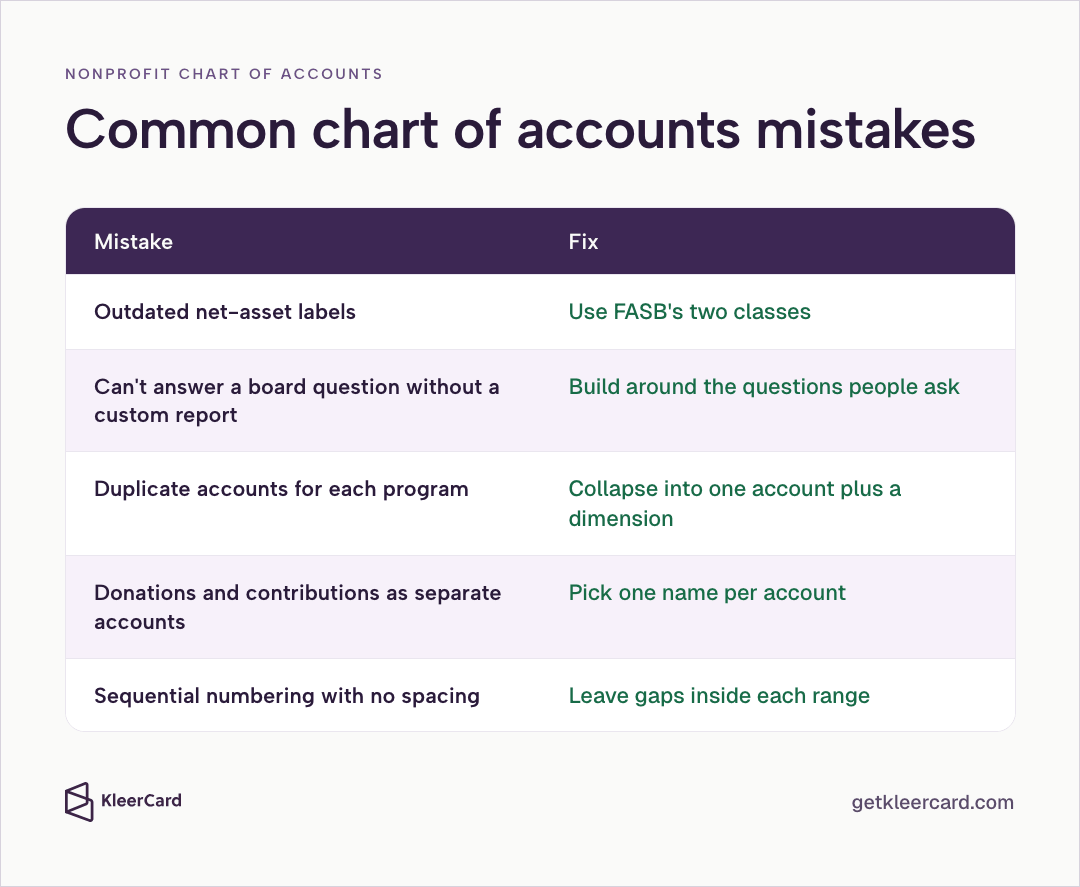
Most nonprofit chart of accounts problems come from a short list of patterns.
Most of these are reversible. Collapse near-duplicate accounts into one, add a dimension, and update the few reports that still point at the old numbers.
Assets, liabilities, net assets, revenue, and expenses. Most charts assign number ranges: assets in the 1000s, liabilities in the 2000s, net assets in the 3000s, revenue in the 4000s–6000s, and expenses in the 7000s–9000s.
There is no required chart. The Unified Chart of Accounts (UCOA), published by the California Association of Nonprofits and the National Center for Charitable Statistics, is a widely used template whose codes cross-reference IRS Form 990 line items. Most organizations adapt a portion of it rather than adopting the whole list. A compiled version is also available through the Nonprofit Financial Commons.
A nonprofit chart of accounts rolls up to Form 990 Part VIII (revenue), Part IX (expenses), and Part X (balance sheet). A chart built with those parts in mind makes the annual return faster to file.
Yes. GAAP and Form 990 Part IX require a 501(c)(3) to split expenses into program services, management and general, and fundraising. You can meet that requirement with one account per expense type plus a dimension for the function.
The chart of accounts is the list of account names and numbers. The general ledger is the record of every transaction posted to those accounts.
That split also matters when you review debits and credits.
A nonprofit needs enough chart-of-accounts lines to answer board and funder questions, and no more. Many small and mid-size nonprofits run well on a few dozen accounts and use dimensions for program and fund detail.
Use four-digit ranges by category: 1000s for assets, 2000s for liabilities, 3000s for net assets, 4000s for revenue, and 5000s or 7000s for expenses. Leave gaps so you can add accounts later without renumbering.
Yes. QuickBooks supports a nonprofit chart of accounts and uses classes for the program and fund detail that keeps the account list short. You can configure QuickBooks for a nonprofit so the tax form and industry settings match Form 990 requirements. The same pattern works in most fund-accounting systems: one account for what you bought, plus a class or fund dimension.
A for-profit chart uses equity accounts for owners. A nonprofit chart replaces equity with net assets and must support donor-restriction tracking and functional expense reporting required by GAAP and Form 990.
Natural classification describes what was purchased (salaries, rent, supplies). Functional classification describes why it was purchased (program, management and general, or fundraising). Both views are required for most nonprofits. Dimensions let you keep those purchase accounts clean while still producing the functional reports.
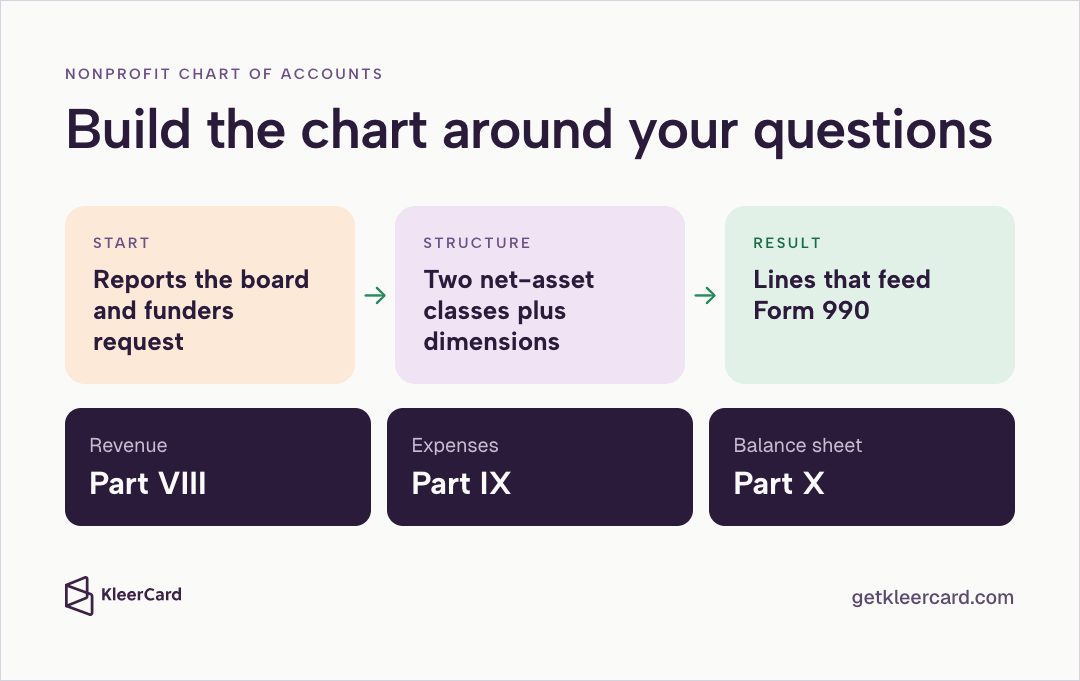
Size a nonprofit chart of accounts to the reports the board and funders already request. Keep net assets in two classes — with donor restrictions and without donor restrictions — and put program, fund, and function on dimensions instead of new account numbers.
When those accounts are set that way, revenue feeds Form 990 Part VIII, expenses feed Part IX, and the balance sheet feeds Part X.
The functional-expense report that a nonprofit chart of accounts should support is in the statement of functional expenses guide.


Speak to a member of our team and we can have you up and running in minutes, not weeks.